A Cross-Tab report is one that summarizes information from a database and displays the result in a spreadsheet like structure. Reports of this type are useful for summarizing large amounts of information and identifying trends in data.
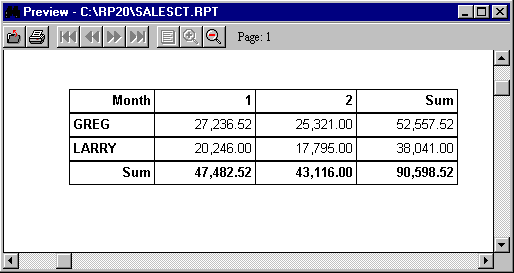
A classic example of a Cross-Tab report is to sum monthly sales figures by salesman. Assume that you have a table that contains the following fields: salesman, sale date and sale amount. Using Cross-Tabs, you could easily generate the following report which shows each salesman's performance.
To create a Cross-Tab report, choose the File, New, Cross-Tab Report option from ReportPro's main menu. You can also create a Cross-Tab report using the Cross-Tab Report Wizard discussed in the next chapter.
The initial process of creating a Cross-Tab report is similar to creating a Standard report in that you must specify a data source. This process is covered in detail in the previous section.
After you define a data source, the Cross-Tab Configuration dialog will be displayed.
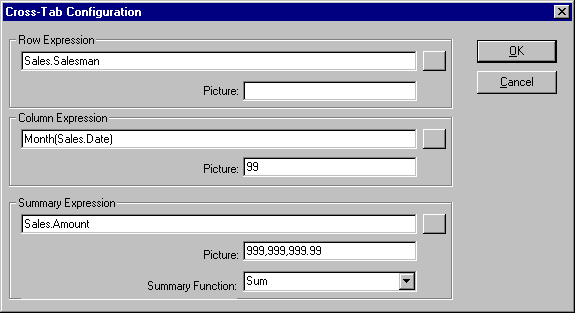
To define a Cross-Tab, you must specify a row, a column and a summary expression. The expressions can be entered directly or via the Expression Builder. To access the Expression Builder, click the square button to the right of the desired edit.
The Picture edit, which is available for each expression, allows you to specify an optional picture clause which is used to format the expression's value. See Appendix A for more information on picture clauses.
The Row Expression governs the values that are displayed in the Row Label (left most) column of the Cross-Tab. The row expression is evaluated for each record in the data source. Each unique value returned by the expression will get a row in the Cross-Tab.
The Column Expression determines the values that are displayed in the Column Label (top) row. The column expression is also evaluated for each record in the data source. Each unique value returned by the expression will get a column in the Cross-Tab.
Finally, the Row and Column values are cross-referenced and summarized using the Summary Expression. The Summary Function list box allows you to specify which mathematical operation is performed on the summary expression. Five summary functions are available, but Average and Sum are only available for summary expressions that return a number.
Function |
Description |
Average |
Determines the average of all cross-referenced values |
Count |
Counts all cross-referenced values |
Maximum |
Determines the largest cross-referenced value |
Minimum |
Determines the smallest cross-referenced value |
Sum |
Sums all cross-referenced values |
After you have entered all three expressions and selected a summary function, click the OK button. ReportPro will create the report and automatically layout the Cross-Tab Field objects. You can change the size and location of the Cross-Tab Field objects but they cannot be moved out of their original band.
Table of contents
-
Index
- Copyright
- Installation
- Getting Help
- ReportPro's Design Interface
- ReportPro's Menu System
- ReportPro's Shell Menu
- ReportPro's Work Window Menu
- ReportPro's Pop-up Menus
- ReportPro's Expression Builder
- Building Expressions
- Creating a Report
- Creating a Standard Report
- Creating a Label Report
- Creating a Cross-Tab Report
- Using an ODBC Data Source
- Report Wizards
- Standard Report Wizard
- Label Report Wizard
- Cross-Tab Report Wizard
- Opening a Report
- Saving a Report
- Configuring ReportPro
- Configuring a Report
- Configuring Sections
- Configuring Local Tables
- Configuring SQL Sources
- Configuring the Printer
- Bands
- Configuring Bands
- Drawing Tools
- Configuring Report Objects
- Align
- Set Size/Position
- Background Style
- Border Style
- Print When
- Shadowing
- Line Style
- Auto Size
- Font
- Text Align
- Field Style
- Picture Style
- Field Wizard
- Object Inspector
- Grouping
- Variables
- Print Preview
- Printing
- Abs()
- AddressBlk()
- Alltrim()
- Asc()
- At()
- AtNoCase()
- AtLineNum()
- AtLineNoCase()
- CDOW()
- Ceiling()
- Chr()
- CMonth()
- Cosine()
- Cotangent()
- CTOD()
- Day()
- Descend()
- DOW()
- DTOC()
- DTOS()
- ElapsedTime()
- Empty()
- GroupMembers()
- HardCR()
- HoursBetween()
- iif()
- Integer()
- IsAlpha()
- IsBetween()
- IsDigit()
- IsLower()
- IsUpper()
- Left()
- Len()
- Log()
- Lower()
- LTrim()
- Max()
- MakeDate()
- MakeTime()
- MemoLine()
- MemoTran()
- Min()
- MLCount()
- Modulus()
- MinutesBetween()
- Month()
- Num2CDOW()
- Num2CMonth()
- NumTrim()
- OccursIn()
- Pad()
- Power()
- PgCount()
- PgNo()
- Properize()
- Rand()
- RAt()
- Replicate()
- Right()
- Round()
- RpEOF()
- RpSQLCol()
- Sec2Days()
- Sine()
- Space()
- SqRt()
- Str()
- StrTran()
- Stuff()
- SubStr()
- Tangent()
- Time()
- Today()
- Trim()
- Upper()
- Val()
- Year()
- LightLib
- Database Drivers
- Appendices