With the exception of the Pointer Tool, ReportPro's Drawing Tools are used to create the report objects which generate the printed output. ReportPro provides several different types of drawing tools, one for each object type. To select a drawing tool, use the Tools, Drawing Tools menu or select the tool directly from ReportPro's toolbar.
A report object is created by selecting the proper drawing tool and using the tool to draw the object on the report surface. The object is drawn by pressing the left mouse button at the desired origin of the object, then dragging the mouse until the desired object size is reached while still holding down the left mouse button. When the left mouse button is released, the object is created at the size and location you specified.
In some cases, ReportPro will prompt you for additional information before the object is created. For example, when you create a field object, ReportPro prompts for the expression used by the field object to extract data from the data source.
Each of the drawing tools supported by ReportPro is discussed below.
Pointer Tool
The Pointer Tool allows you to manipulate other report objects. The following table lists the tasks that can be performed with the pointer tool. It also provides a brief description on how to perform the task.
Function |
Description |
Selecting an Object |
To select an object, point at the object with the mouse and click the left mouse button. |
Selecting Multiple Objects |
To select multiple objects, first select an individual object. Next select the other objects while holding down the Shift key.
Multiple objects can also be selected by drawing a rectangle area with the pointer. All objects touched by the rectangle will be selected. |
Moving |
To move an object, point the pointer tool at the object and drag the object while holding down the left mouse button. It is also possible to move multiple objects. |
Sizing |
To size an object, select the object you wish to size. Then point the pointer tool at the sizing boxes located on the object's bounding box. Stretch the object to the new size while holding down the left mouse button. |
Line Tool
The Line tool is used to add straight lines to the report.
Rectangle Tool
Use the Rectangle tool to add squares and rectangles to your reports.
Ellipse Tool
Use the Ellipse too to add circles and ellipses to your reports.
Field Tool
Use the Field tool to create objects that retrieve information from your databases. You can also use the field objects to access user defined variables.
After you draw the field object on your report, ReportPro's Expression Builder appears. For more information on expressions, see the chapter entitled "ReportPro's Expression Builder".
Text Tool
To add fixed text to a report, use the Text Tool. After you draw the text box, the text object will be displayed in the Edit mode. Type the desired text into the text object. When you select a menu option or another report object, the text object will exit the edit mode. To return to the edit mode, select the Text Tool, point the mouse pointer at the text object and click the left mouse button.
Picture Tool
To add images to your report, use the Picture Tool. After you draw the picture object, you are presented with a series of dialogs that allow you to specify the source of the image.
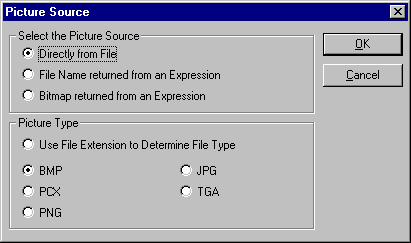
ReportPro can retrieve the image from several different sources:
Image Source |
Description |
Directly From File |
This option allows you to specify a file name to retrieve the image from. |
File Name returned from an Expression |
With this option, you specify an expression that returns file names. This feature is useful if the file names of the images are stored in a database. If you place the image in the Page Body band, this would result in a different image being printed for each record in the database. |
Bitmap returned from an Expression |
The feature allows you to display Bitmap images that are stored in a database. |
ReportPro supports a variety of image formats including BMP, PCX, PNG, JPG and TGA. If you choose to load the image from a file, you can have ReportPro automatically detect the image format based on the file extension. If you know the image type, or if you don't use standard file extensions, you should specify the proper image type.
The only image format that is currently supported when an image is returned from an expression is BMP.
Depending on the Picture Source you choose in the Picture Source dialog, you will either be prompted to specify a file name or an expression which will be used to retrieve the image.
Embedded Section Tool
This tool allows you to create an Embedded section. An Embedded section is a section that prints within a rectangular area inside another section. Embedded sections are useful for placing Cross-Tab or look-up type information along side data from another section.
After you draw the bounding box of the Embedded Section, you will be prompted to specify information about the section. This information includes the section type and data source.
After you specify the section information, the section is created on the report surface. A new section tab is also added to the work window's section tab bar. You cannot edit the Embedded section object from the parent section. You must first select the Embedded section by clicking on it's tab located on the Section Tab Bar. Once the section is selected, you can manipulate the section like any other report section.
Graph (32-bit version only)
The Graph tool allows you to create stunning graphs on your report. After you create a graph object, the Graph Wizard is displayed. The Graph Wizard is a tabbed dialog that allows you to specify all the attributes of a graph. You navigate through the Graph Wizard dialog by clicking on the desired tab at the top of dialog or by pressing the Next > and < Previous buttons.
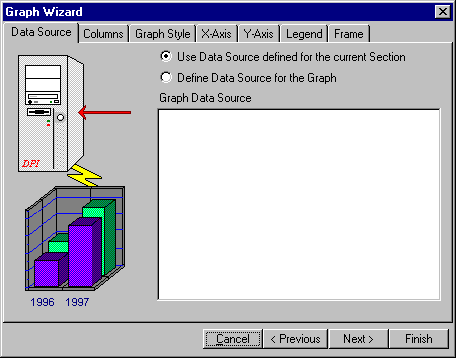
Data Source
The first step in creating a graph is to define where the graph will get its information. Graphs can retrieve information from the data source of the section where they reside or they can have their own data source.
It is important to correctly define the data source. Otherwise, you will not be able to create the proper column expressions. To use the data source of the current section, select the Use Data Source defined for the current Section radio button.
If you wish to define a data source for the graph, select the Define Data Source for the Graph radio button. When you do so, you will be prompted with a series of dialogs that allow you to specify data source information. This procedure is similar to that of adding a new section to your report.
After you have identified the data source, the list box in the middle of the dialog will be updated to reflect your selection. This list box operates in the same manor as the one used in the Setup Sections dialog. You add tables and queries to the data source via pop-up menus that are activated by clicking the right mouse button. Refer to the chapters entitled "Configuring Local Tables" and "Configuring SQL Queries" for a detailed description of each menu option.
Columns
The Columns Tab allows you to define the expressions that are used to retrieve information from the data source. You define the graph columns by adding column objects into the hierarchical list box shown in the figure 39.
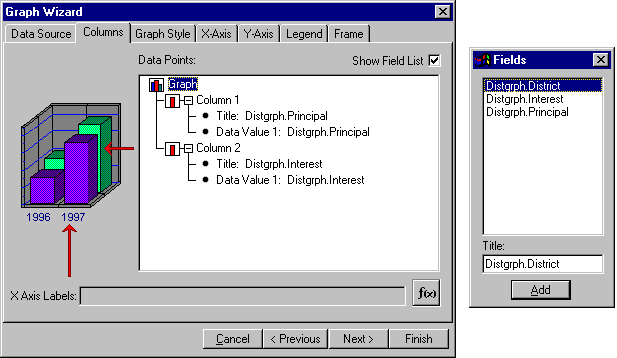
There are two ways to add columns to the graph. If you click the Show Fields List check box, ReportPro will display a floating dialog that contains a list of all the fields available from the data source. You add columns by selecting the desired field in the field list and pressing the Add button. The Title edit at the bottom of the floating dialog allows you to specify a title for the selected field.
You can also add columns by clicking the right mouse button over the Graph icon in the Data Points list box and selected Add Column from the pop-up menu. When you select this method you will be prompted with the Expression Builder where you can specify more complicated expressions.
Once you have added a column to the graph, you can access options related to it by clicking the right mouse button over the desired column icon. Available options include Insert Column, Delete Column and Add Data Point. You can also click the right mouse button over the column title and data value expressions to edit them.
To define an expression that retrieves the x-axis labels from the data source, click on the f(x) icon and the Expression Builder will be displayed to allow you to specify the desired expression. The information returned by this expression will be printed on the x-axis to identify each of the columns.
Graph Style
The Graph Style tab allows you to define the attributes that relate to the entire graph. You'll notice that the remaining tabs display a sample graph in the upper left side of the dialog. This sample grid updates every time you make a change to the graph to give you an indication of what your graph is going to look like.
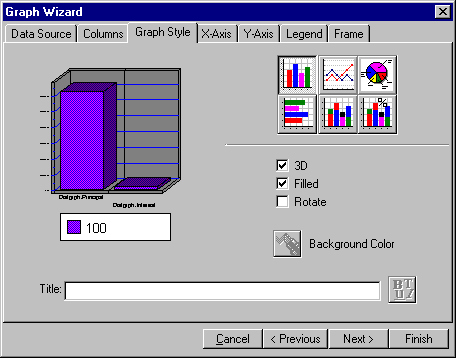
The buttons in the top section of the Graph Style dialog allow you to set the graph type. ReportPro supports Bar, Line, Pie, Horizontal Bar, Stacked Bar and Stacked Percentage bar graphs.
The 3D check box toggles the graph between 2D or 3D modes. The Filled check box fills the bars of the graph when checked otherwise the bars are transparent. The Rotate check box swaps the information on the x-axis with the information in the legend.
The Background Color button sets the background color of pie charts. This feature is not available for the other graph types.
The Title edit allows you to specify the report title. The report title displays at the very top of the graph. The button to the right of the title edit allows you to specify a font for the graph title.
X-Axis
The X-Axis tab allows you to specify attributes related to the x-axis.
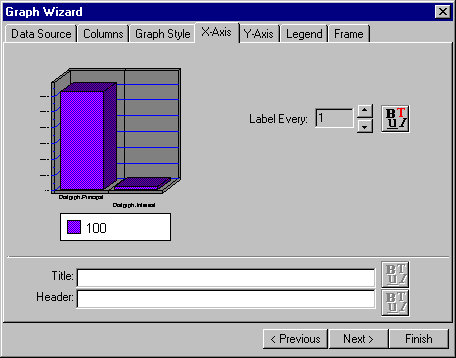
The Label Every spinner allows you to specify the interval at which the labels are displayed. The default interval is one which means a label is displayed for each column in the graph. If you set the interval to two a label will be displayed for every other column. The Label Font button allows you specify a font for the label text.
The Title and Header edits allow you to display descriptive information on the x-axis. The title displays directly below the x-axis while the header displays on the right side of the x-axis. Each edit has an associated font button to allow you to identify the font to use for the title and header.
Y-Axis
The Y-Axis tab allows you to specify attributes related to the y-axis of the graph.
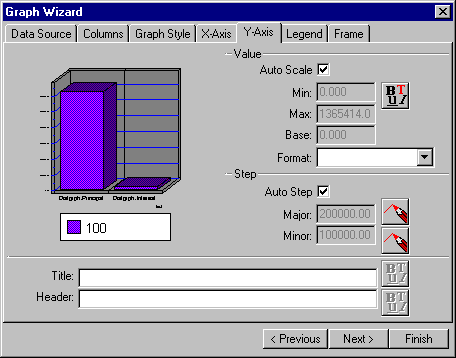
The Value section allows you to control the range of values displayed on the y-axis. The Graph object has an auto scale feature that automatically determines the y-axis scale values. Normally you would leave this option checked. If you wish to manually configure the y-axis range information, uncheck the Auto Scale check box and the remaining edits in the value section will become enabled.
The Min value edit allows you to specify the minimum value that is displayed on the y-axis. The Max value sets the maximum value displayed. The Base edit sets the value where the columns are drawn from.
The Format combo box allows you to specify a picture clause to format the y-axis values with. For more information on picture clauses refer to Appendix A. The Value font button allows you to specify a font for the y-axis values.
The Step section allows you to control the resolution of the graph grid. The graph displays both major and minor grid lines. These edits allow you specify the interval at which the grids lines are drawn. These edits are normally disabled and the Graph object automatically calculates the best grid resolution. If wish to manually set the grid resolution, you must uncheck the Auto Step check box. The color buttons next to each edit allows you to define the color of the grid lines.
The Title and Header edits allow you to attach descriptive information on the y-axis. The title displays vertically beside the y-axis values while the header displays at the top of the y-axis. Each edit has an associated font button to allow you to identify the font to use for the title and header.
Legend
The Legend tab allows you to control the attributes of the graph legend. From here you can specify the position, color and font of the legend.
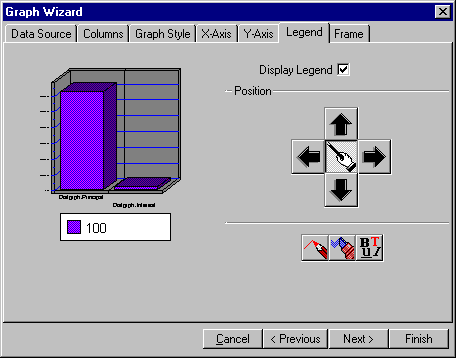
The Display Legend check box allows you to toggle the display of the legend. If this option is unchecked, the legend will not display.
The position buttons allow you to control where the legend is displayed. To move the legend, click the desired arrow. The button in the middle allows the Graph object to automatically calculate the best position for the legend.
The three buttons at the bottom of the dialog allow you to specify the border color, fill color and font respectively.
Frame
The Frame tab allows you to set the attributes related to the frame of the graph. The controls are broken into three sections, one for each of the three walls.
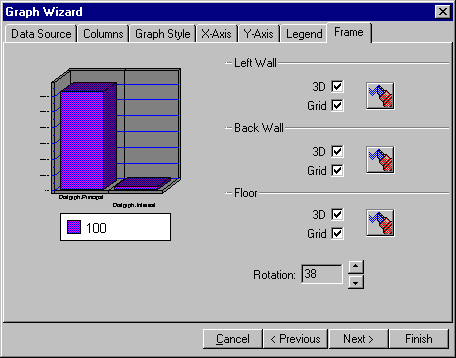
The 3D check box causes the Graph object to draw a three dimensional wall. The Grid check box toggles the display of a grid on the wall. The color button allows you specify the color of the wall.
The Rotation spinner allows you to rotate the graph to modify the user's perspective of the graph.
Table of contents
-
Index
- Copyright
- Installation
- Getting Help
- ReportPro's Design Interface
- ReportPro's Menu System
- ReportPro's Shell Menu
- ReportPro's Work Window Menu
- ReportPro's Pop-up Menus
- ReportPro's Expression Builder
- Building Expressions
- Creating a Report
- Creating a Standard Report
- Creating a Label Report
- Creating a Cross-Tab Report
- Using an ODBC Data Source
- Report Wizards
- Standard Report Wizard
- Label Report Wizard
- Cross-Tab Report Wizard
- Opening a Report
- Saving a Report
- Configuring ReportPro
- Configuring a Report
- Configuring Sections
- Configuring Local Tables
- Configuring SQL Sources
- Configuring the Printer
- Bands
- Configuring Bands
- Drawing Tools
- Configuring Report Objects
- Align
- Set Size/Position
- Background Style
- Border Style
- Print When
- Shadowing
- Line Style
- Auto Size
- Font
- Text Align
- Field Style
- Picture Style
- Field Wizard
- Object Inspector
- Grouping
- Variables
- Print Preview
- Printing
- Abs()
- AddressBlk()
- Alltrim()
- Asc()
- At()
- AtNoCase()
- AtLineNum()
- AtLineNoCase()
- CDOW()
- Ceiling()
- Chr()
- CMonth()
- Cosine()
- Cotangent()
- CTOD()
- Day()
- Descend()
- DOW()
- DTOC()
- DTOS()
- ElapsedTime()
- Empty()
- GroupMembers()
- HardCR()
- HoursBetween()
- iif()
- Integer()
- IsAlpha()
- IsBetween()
- IsDigit()
- IsLower()
- IsUpper()
- Left()
- Len()
- Log()
- Lower()
- LTrim()
- Max()
- MakeDate()
- MakeTime()
- MemoLine()
- MemoTran()
- Min()
- MLCount()
- Modulus()
- MinutesBetween()
- Month()
- Num2CDOW()
- Num2CMonth()
- NumTrim()
- OccursIn()
- Pad()
- Power()
- PgCount()
- PgNo()
- Properize()
- Rand()
- RAt()
- Replicate()
- Right()
- Round()
- RpEOF()
- RpSQLCol()
- Sec2Days()
- Sine()
- Space()
- SqRt()
- Str()
- StrTran()
- Stuff()
- SubStr()
- Tangent()
- Time()
- Today()
- Trim()
- Upper()
- Val()
- Year()
- LightLib
- Database Drivers
- Appendices